First, here's the "per capita" chart for greenhouse gases that pro-Kyoto people like to refer to:
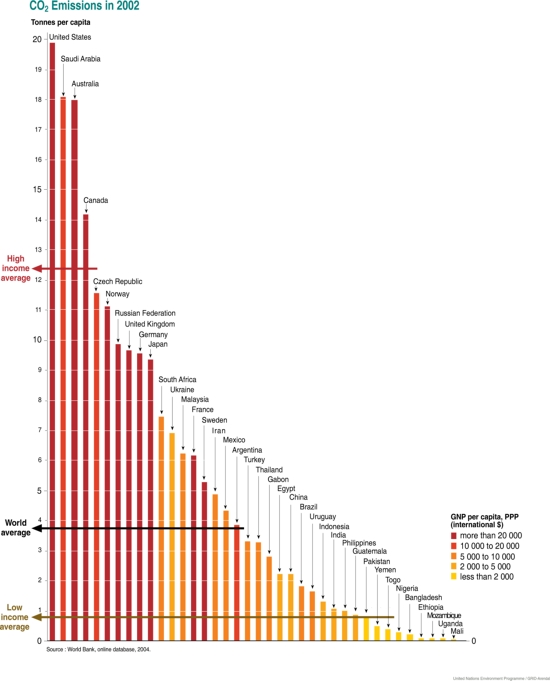
Yes, yes, Australia looks bad on a per capita basis. However, the next chart shows some total figures:
 Where does Australia fit in? It's kind of confusing because of the different ways different charts are counting carbon, but the Australian National Greenhouse Gas Inventory says:
Australia’s net greenhouse gas emissions across all sectors totalled 564.7 million tonnes of carbon dioxide equivalent (Mt CO2-e) in 2004 under the accounting provisions applying to Australia’s 108% emissions target.
That figure sounds about right, according to the next chart too. Anyway, the USA and Europe are pretty much on top. However, here's the really worrying thing (assuming you think CO2 is a worry):
 Just look at that growth curb for China. It hits US levels in a little over 10 years time, and then keeps climbing. I am not sure if this is on a "do nothing" basis or not. However, even on current "do something" ideas, I doubt it's going to have much effect within 10 years.
China is, of course, amongst the many countries which Kyoto doesn't currently cover, as shown clearly shown here:

Finally, projections for CO2 increase over the next 100 years or so (on a "business as usual" basis):
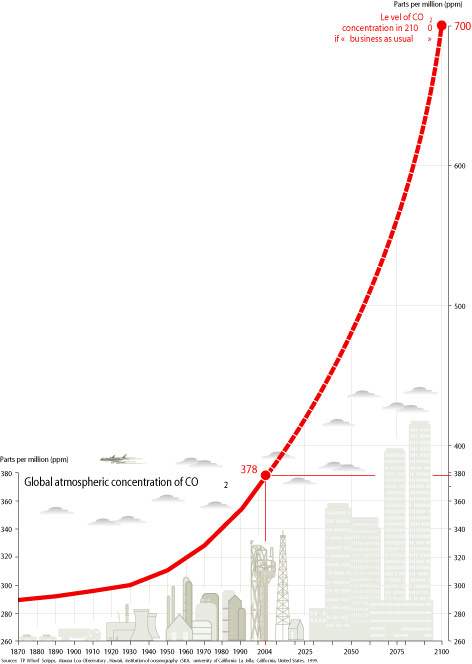
Kind of a steep curve, hey.
The lesson I take from this is: the really, really serious issue is preventing China's huge climb, as well as reducing the US. As the US is already economically advanced, I guess there is greater grounds for optimism that it can develop and afford the technological fixes which may help. But there will be a huge need to get those technologies into China fast. How the international community can help China in this process is not a topic I can say I have heard a lot about.
No comments:
Post a Comment